More Related Content
Similar to Montgomery county basic supply and demand
Similar to Montgomery county basic supply and demand (20)
More from Prudential Fox & Roach, Realtors
More from Prudential Fox & Roach, Realtors (20)
Montgomery county basic supply and demand
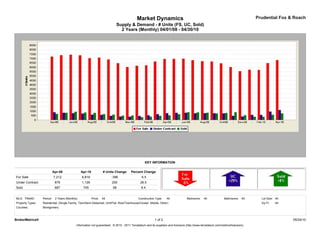
- 1. Market Dynamics Prudential Fox & Roach
Supply & Demand - # Units (FS, UC, Sold)
2 Years (Monthly) 04/01/08 - 04/30/10
KEY INFORMATION
Apr-08 Apr-10 # Units Change Percent Change
For Sale 7,212 6,816 -396 -5.5
Under Contract 876 1,126 250 28.5
Sold 687 745 58 8.4
MLS: TReND Period: 2 Years (Monthly) Price: All Construction Type: All Bedrooms: All Bathrooms: All Lot Size: All
Property Types: Residential: (Single Family, Twin/Semi-Detached, Unit/Flat, Row/Townhouse/Cluster, Mobile, Other) Sq Ft: All
Counties: Montgomery
BrokerMetrics® 1 of 2 05/24/10
Information not guaranteed. © 2010 - 2011 Terradatum and its suppliers and licensors (http://www.terradatum.com/metrics/licensors).
- 2. Market Dynamics Prudential Fox & Roach
Supply & Demand - # Units (FS, UC, Sold)
2 Years (Monthly) 04/01/08 - 04/30/10
FOR SALE UNDER CONTRACT SOLD EXPIRED NEW LISTINGS
Time Period # Properties Average DOM # Properties Average DOM # Properties Average DOM # Properties Average DOM # Properties
Apr-10 6,816 148 1,126 75 745 81 446 172 1,778
Mar-10 6,466 173 952 75 580 93 476 195 1,752
Feb-10 5,692 206 574 93 356 101 404 213 1,066
Jan-10 5,713 222 573 94 358 90 514 212 1,224
Dec-09 5,552 244 393 96 534 88 670 214 576
Nov-09 6,015 242 468 91 873 80 571 205 892
Oct-09 6,445 239 745 75 785 90 577 219 1,118
Sep-09 6,653 239 760 82 735 84 566 186 1,296
Aug-09 6,681 244 763 90 817 83 561 185 1,150
Jul-09 6,802 244 756 87 852 84 515 185 1,223
Jun-09 6,972 246 817 89 873 81 576 209 1,314
May-09 6,950 248 810 84 647 87 482 198 1,306
Apr-09 6,937 248 769 85 512 86 524 161 1,470
Mar-09 6,651 256 656 84 463 101 528 189 1,461
Feb-09 6,217 271 531 97 366 99 496 218 1,208
Jan-09 6,161 275 444 101 311 86 708 209 1,115
Dec-08 6,020 282 359 94 498 82 615 205 558
Nov-08 6,462 271 384 86 484 77 616 166 757
Oct-08 6,887 260 460 80 602 76 722 157 1,071
Sep-08 7,094 252 573 73 661 71 705 155 1,339
Aug-08 7,033 250 604 71 793 67 674 174 1,136
Jul-08 7,355 241 713 76 837 66 745 177 1,436
Jun-08 7,425 238 768 67 928 62 738 194 1,528
May-08 7,374 233 816 65 805 73 661 151 1,674
Apr-08 7,212 229 876 65 687 79 636 150 1,818
BrokerMetrics® 2 of 2 05/24/10
Information not guaranteed. © 2010 - 2011 Terradatum and its suppliers and licensors (http://www.terradatum.com/metrics/licensors).